What exactly are B2B website conversion rates? And what are the benchmarks for these subset group of metrics. In short, they’re averages of how many leads convert into opportunities.
A conversion metric to be keep track of is the rate of form-fills that turn into meetings-held. But, at the end of the day, all marketers want to know is if they’re B2B conversion rate matches up with what other businesses in their industry. By understanding where you stand, you can see if you are on track with the competition, or if you need to improve. Having this knowledge allows you to set goals and achieve a higher percentage of conversions. Here is some helpful advice, along with current conversion rate benchmarks.
Conversion rate benchmarks for websites
- SEO
- Forms
- Website aesthetics
- Site navigation
- UX design
- Mobile optimization
- Page load time
- Copywriting
On top of that, conversion rates can vary considerably from industry to industry. So, there are a lot of factors at play when determining what the ultimate conversion rate is. That said, a comprehensive study by WordStream pinpointed exactly what the average conversion is for all B2B companies across the board.
In addition, conversion rates vary significantly from industry to industry. So, a lot of factors need to be considered when determining the optimal rate. That said, WordStream’s comprehensive study found an average B2B website conversion rate for all companies researched.
The average company B2B conversion rate is, 2.23%!
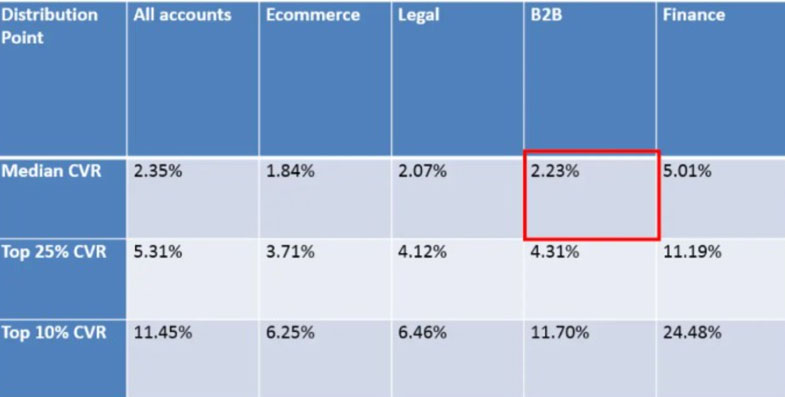
That’s the average conversion rate for all B2B companies. Understandably, every business in this sphere is trying to improve their CRO! However, more data exists. The average conversion rate for B2B companies in the top 25 percentile is 4.31%.
What’s interesting is that this 2.08% is higher than the average B2B company conversion rate of 2.23%.
Here is where conversion rate benchmarks become super interesting.
The average B2B website conversion rate for the best websites in the top 10%, is 11.70%. The average conversion rate for B2B brands is only 2.23%, but the top performers boast rates almost 9.47% higher than that. In fact, the most successful companies see conversions five times greater than their competition!
As you know, these are just conversion rate benchmarks.
So what does this mean for you?
In short, if your conversion rate is below 2.23%, there might be some areas of improvement in your funnel process..
However, if your B2B website conversion rates sit at only 10%, you’re still doing better than most of your competition. Inbound conversions can always be improved though. Don’t forget, why spend time and money on creating demand if you can’t convert it?
In order to keep their funnel from losing potential customers, high-performing revenue teams use inbound conversion platforms.
Check out how QikChat can help double your inbound conversion rate.
B2B website conversion rates averages for desktop, tablet, and mobile
It’s also important to note that website conversion rate benchmarks vary greatly between different devices, so it is essential to consider this data when evaluating the success of your marketing and sales strategies.
The most recent ecommerce data from Statista, finds:
- The average conversion rate for desktop is 3.9%
- Tablet is 2.2%
- Mobile phone is 3.5%
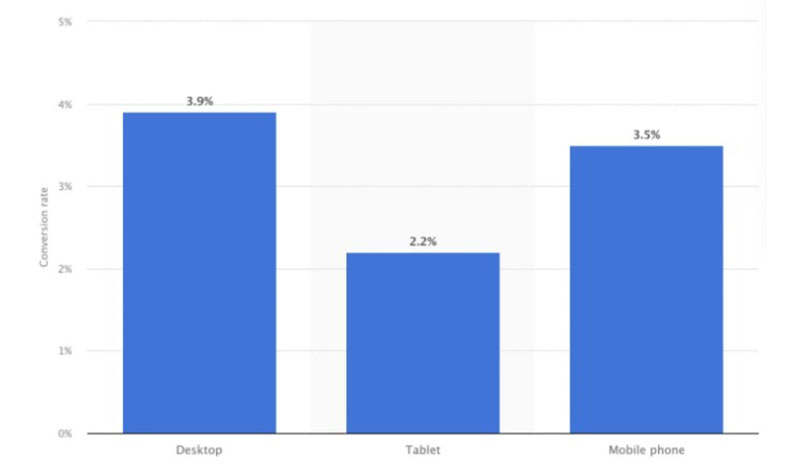
It’s important to note that the average conversion rate for mobile phones in 2020 was an astounding 1.53%, surpassing tablets and coming close to matching desktop! As smartphones become more advanced, users are spending even more time on their devices – which points towards a mobile-first world. With this trend expected to continue, it is essential for businesses to optimize for responsiveness so as not be left behind!
These varying device factors will always play a role in yours sales teams final B2B conversion rate when turning leads into customers, something to always be mindful of.
Conversion rate benchmarks by ad provider
Your B2B website conversion rates will always be impacted by which advertising channel your traffic is coming from and knowing which has the historically highest conversion rate, should be a determining factor when assessing which channel to advertise on.
In 2021, the U.S.’s digital ad expenditure amounting to 186 billion U.S. dollars eclipsed the total spent by China, Japan, Germany and the United Kingdom combined!
Tell me thats a lot of money, without telling thats a lot of money! With a large portion of this money allocated to Google Ads, it’s obvious that there is intense competition.
If you’re hoping to generate significant returns on your advertisement budget and consequently high conversion rates, let’s take a look at the PPC benchmark for conversions. According to Heap, a data behavioral analytics business, Bing and Google have the highest conversions rates of around 8%, which is an astounding 1.5 times higher than Facebook’s conversion rate.
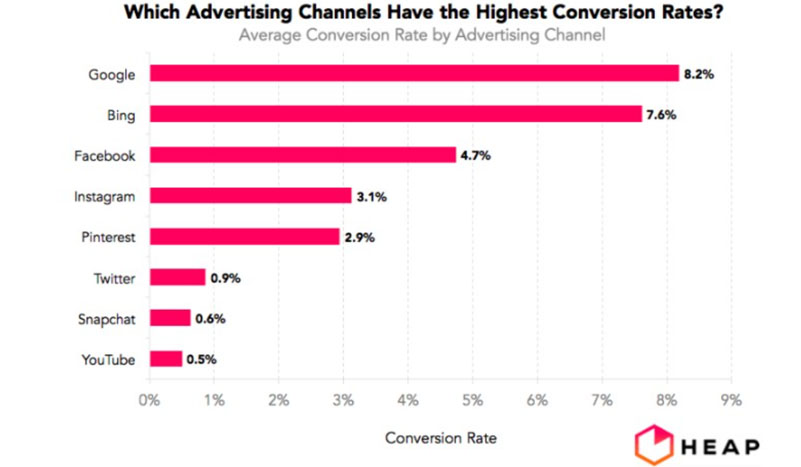
I find this incredibly intriguing because it seems Google Ads have maintained their relevance while Facebook ads seem to be nearing a point of over-saturation.
Social media ads are intrusive by nature, whereas search engine ads target users based on the purpose of their query. This makes sense as it puts them in control and allows for more targeted results.
Consequently, leads from search engine ads generally have higher levels of qualification and interest.
This graph from Heap’s research reveals the remarkable difference between various providers in terms of their conversion rate. Take a look and be amazed!
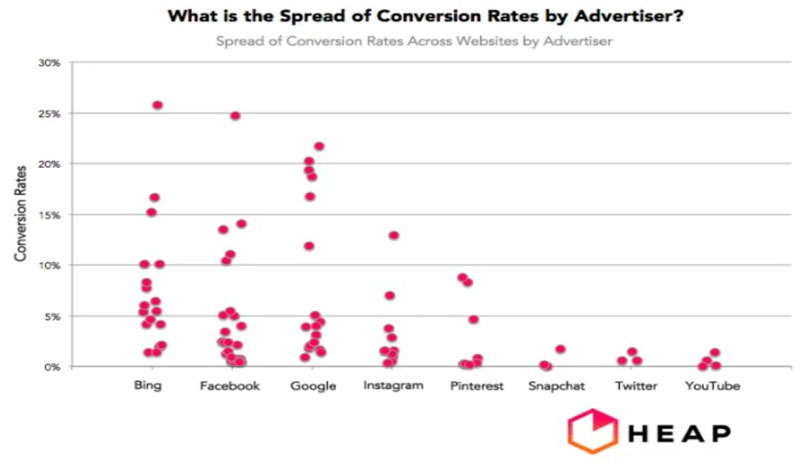
Bing, Facebook and Google are the clear frontrunners when it comes to conversion rate optimization.
Meaning, this is something you should deeply consider to understand where you think you can land on this spectrum for your B2B website conversion rates.
There could be a slew of reasons why this disparity is happening, ranging from inexperienced marketers utilizing these platforms to users experimenting with conversion rate optimization.
Similarly, highly efficient conversion rates are likely a result of professional marketers and extraordinary copywriters who comprehend their target audience’s struggles in detail.
When the size of an audience becomes too large, sustaining a conversion rate of 25% is next to impossible on these platforms. That’s why the spread between them is so vast.
To get the most out of our time, let’s dive into two of today’s leading digital ads platforms – Facebook and Google.
Google Ads conversion rate benchmarks
WordStream conducted an extensive analysis of the Google Ads conversion rate across various industries to gain a better understanding of how it changes from one sector to another.
On average, Google Ads can boast a 4.40% conversion rate – as made evident by the infographic below!
The disparity between industries is reall stands out, with apparel scarcely reaching 3% while vehicles peak at over 8%.
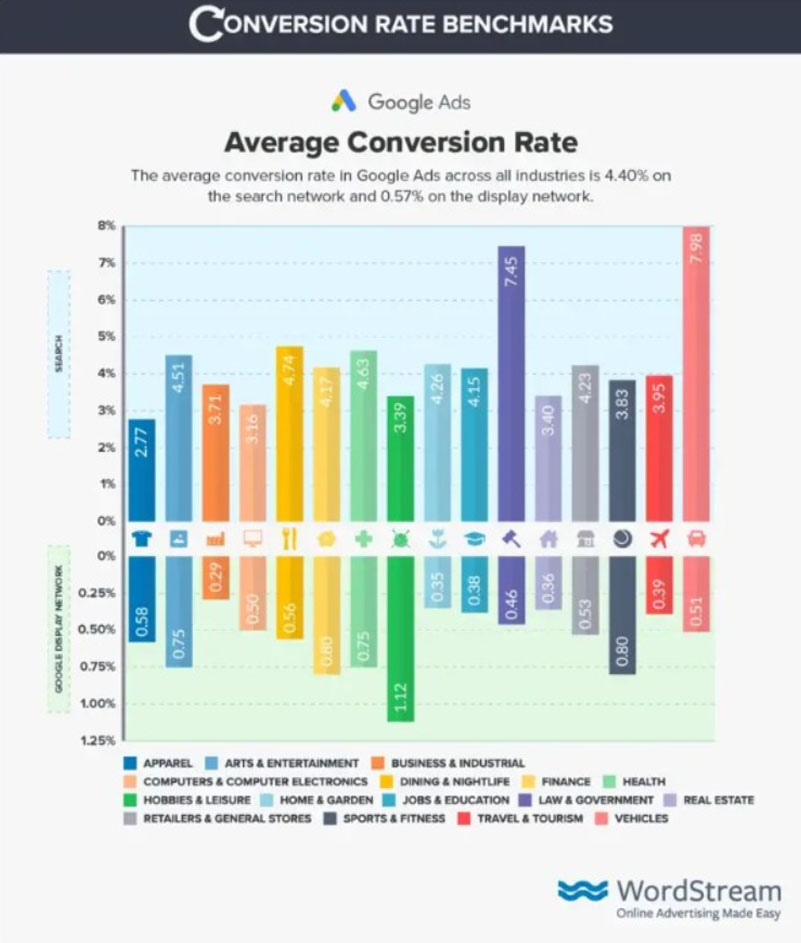
When we compare the average conversion rate on the search network to that of the display network, we can observe a drastic difference – 4.40% for searches and 0.57% for displays!
This would have a massive impact on the potential success of your B2B website conversion rates, as if you select the display campaign type in Google Ads, now you have an indication as to how well it will really work.
As we discussed before, it’s very different when someone is actively looking for an answer compared to being interrupted while browsing. A very interesting insight into the interactivity that occurs within the behavior of the user.
Previous studies indicate that the conversion rate standard of search networks is 3.75%, while for display networks, it stands at 0.77%.
Unbelievably, searches increased by 17%, while the display network experienced an astonishing 26% drop! It is becoming more and more clear that people are no longer willing to accept interruptions.
Facebook Ads conversion rate benchmarks
Across all industries, the average website conversion rate for Facebook Ads is an impressive 9.21%. Astonishing discrepancies in conversion rates were revealed between industries when utilizing the same advertising provider, according to research.
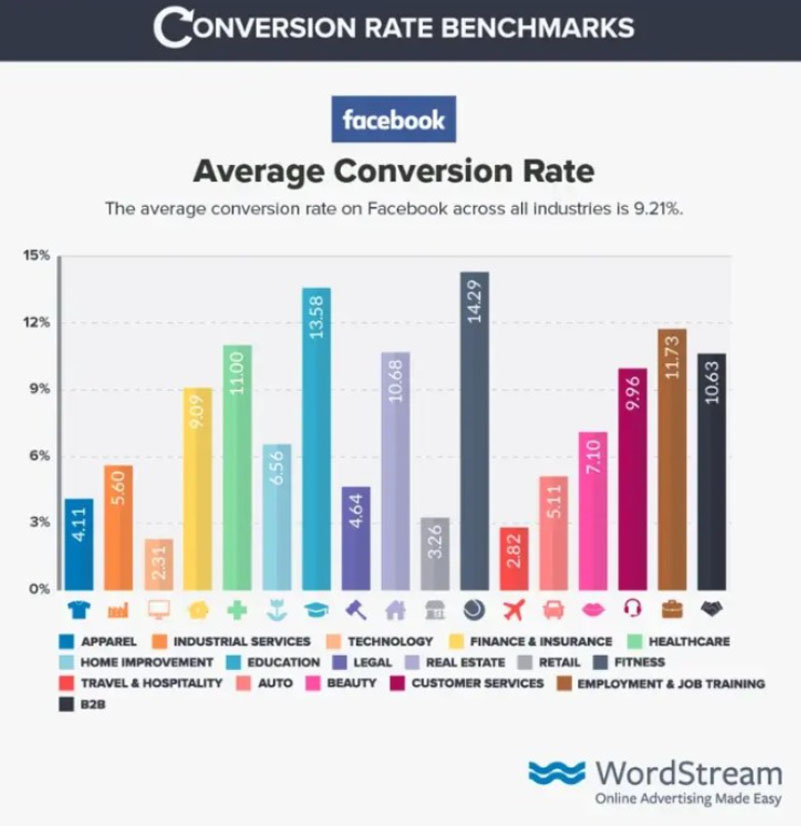
If you own a gym, offer personal training services, or any other fitness-related business, not advertising on Facebook would be an immense oversight. The typical advertiser in this industry yields a remarkable average conversion rate of more than 14%!
However, Facebook Ads isn’t a golden nugget.
Companies in the travel, legal and tech industries often find it difficult to generate website conversion rates in decent ranges. Specifically, rates for these sectors reach an average of 2.28%, 4.64% and 2.31% respectively.
Wrapping up B2B website conversion rates
Paying attention to B2B website conversion rates is undoubtedly the most critical factor for any business-to-business company.
In summary, it strongly impacts your sales team’s success, affecting revenue directly and potentially creating a barrier to linear long-term success.
Before delving into conversion rate benchmarks, it is essential to keep in mind that they are merely guidelines. To ensure maximum marketing efficiency, take a hands-on approach and decide what qualifies as a top-notch lead.
With this insight, you can leverage it to not only reduce customer churn and improve customer retention but also increase your revenue.
Be mindful to always monitor these key metrics, to make sure that there is always strong alignment between B2B website conversion rates and B2B lead conversion rates.


